


What Is the Fear and Greed Index in Crypto?
The Fear & Greed Index measures market sentiment on a scale of 0-100. Learn how it works, what it tells you, and how to use it for smarter trading decisions.
You've probably heard traders say things like "the market is greedy right now" or "fear is taking over." But how do you actually measure that?
That's what the Fear & Greed Index does. It takes the vague concept of "market mood" and turns it into a single number you can use to make better trading decisions.
Here's everything you need to know about it.
What Is the Fear & Greed Index?
The Fear & Greed Index is a sentiment indicator that measures the emotional state of the crypto market on a scale of 0 to 100:
- 0-25: Extreme Fear
- 25-45: Fear
- 45-55: Neutral
- 55-75: Greed
- 75-100: Extreme Greed
When the index is low (fear), people are scared and selling. When it's high (greed), people are euphoric and buying aggressively.
The index was originally created for the stock market by CNN Business. The crypto version, popularized by Alternative.me, adapts the concept for Bitcoin and cryptocurrency markets.
Why Does Market Sentiment Matter?
Crypto prices aren't just driven by fundamentals — they're heavily influenced by emotions.
When people are fearful:
- They sell even good assets
- Prices often drop below fair value
- Buying opportunities emerge
When people are greedy:
- They buy even overpriced assets
- Prices often rise above fair value
- Risk of corrections increases
The legendary investor Warren Buffett summarized it perfectly: "Be fearful when others are greedy, and greedy when others are fearful."
The Fear & Greed Index helps you see what "others" are feeling right now.
How Is the Index Calculated?
The crypto Fear & Greed Index combines several data points:
1. Volatility (25%)
High volatility often signals fear. When prices swing wildly, people get nervous. The index compares current volatility to 30-day and 90-day averages.
2. Market Momentum/Volume (25%)
When buying volume is high relative to recent averages, it suggests greed. When volume drops or selling dominates, it suggests fear.
3. Social Media (15%)
The index analyzes hashtags, mentions, and engagement rates on platforms like Twitter/X. Unusually high activity often correlates with greed; declining interest suggests fear.
4. Surveys (15%)
Some versions include direct polling of traders and investors about their market outlook.
5. Bitcoin Dominance (10%)
When Bitcoin's market share increases, it often signals fear (people moving to the "safe" crypto). When altcoins surge, it suggests greed and risk-taking.
6. Google Trends (10%)
Search interest in terms like "buy Bitcoin" vs "Bitcoin crash" can indicate sentiment shifts.
How to Read the Fear & Greed Index
Extreme Fear (0-25)
What it means: The market is panicking. Prices have likely dropped significantly. People are selling in fear of further losses.
What to consider: Historically, extreme fear has often been a good buying opportunity. When everyone is scared, assets are often undervalued.
Caution: Don't catch falling knives. Extreme fear can persist, and prices can keep dropping. Use other indicators alongside sentiment.
Fear (25-45)
What it means: The market is nervous but not panicking. Some selling pressure, cautious outlook.
What to consider: Might be a good time to start building positions slowly, especially if fundamentals are solid.
Neutral (45-55)
What it means: The market is balanced. No strong emotion in either direction.
What to consider: Often a period of consolidation. Watch for breakouts in either direction.
Greed (55-75)
What it means: Optimism is building. People are buying, prices rising. The mood is positive.
What to consider: Be careful about buying more at elevated prices. Consider taking some profits if you're already in positions.
Extreme Greed (75-100)
What it means: Euphoria. Everyone thinks prices will keep going up forever. FOMO is rampant.
What to consider: Historically, extreme greed often precedes corrections. This is typically a bad time to buy and a good time to take profits.
Historical Examples
COVID Crash (March 2020)
The Fear & Greed Index hit 8 — deep extreme fear. Bitcoin dropped to around $4,000. Those who bought during this fear saw massive gains as Bitcoin eventually hit $69,000.
Bull Market Peak (November 2021)
The index reached 84 — extreme greed. Bitcoin was at its all-time high near $69,000. Shortly after, the market began a prolonged decline.
FTX Collapse (November 2022)
Fear & Greed dropped to 20 after the FTX exchange collapsed. Bitcoin fell to around $16,000. This turned out to be near the cycle bottom.
The pattern repeats: extreme readings often mark turning points.
How to Use the Index in Your Trading
1. Contrarian Entry/Exit Signals
The classic approach: buy when others are fearful, sell when others are greedy.
- Below 20: Start looking for buying opportunities
- Above 80: Consider taking profits
This doesn't mean buy/sell immediately at these levels, but start paying attention.
2. Confirmation Tool
Use the index to confirm other signals. If your technical analysis suggests a reversal, and sentiment is at an extreme, that's stronger confirmation.
3. Risk Management
Adjust your position sizing based on sentiment:
- Extreme greed: Smaller new positions, tighter stops
- Extreme fear: Larger positions (if fundamentals support it), wider stops to handle volatility
4. Timing DCA
If you dollar-cost average, consider buying more when fear is high and less when greed is extreme.
Common Mistakes
1. Using It as a Sole Indicator
The Fear & Greed Index is one tool, not a complete system. It doesn't tell you direction or timing — just sentiment.
2. Acting on Every Movement
The index fluctuates daily. Don't trade every swing. Focus on extremes (below 25, above 75).
3. Ignoring the Trend
In a strong bull market, "extreme greed" can persist for weeks or months before a correction. In bear markets, fear can dominate for extended periods. The index doesn't tell you when reversals will happen.
4. Confusing Correlation with Causation
Low fear doesn't cause prices to rise — it just indicates potential. You still need a catalyst.
Limitations of the Fear & Greed Index
It's a lagging indicator. Sentiment often reflects what just happened, not what will happen.
It can stay extreme for a long time. Markets can remain irrational longer than you can remain solvent.
It's not precise. Different calculations give different numbers. The exact value matters less than the general zone.
It doesn't account for everything. Macro events, regulations, and specific project news aren't directly measured.
Where to Check the Fear & Greed Index
Several sources provide crypto Fear & Greed data:
- Alternative.me — The most popular crypto version
- CoinMarketCap — Shows fear & greed alongside price data
- Flicker — Built into the app for quick reference
Having it accessible in your trading workflow helps you check sentiment before making decisions.
How Flicker Uses Fear & Greed
In Flicker, we integrate the Fear & Greed Index directly into the app so you can see market sentiment at a glance.
But we go beyond just showing a number:
- Context with signals — See how current sentiment relates to our trading signals
- Historical comparison — View how sentiment has changed over time
- Smart money correlation — Compare retail sentiment with what big players are doing
- Alert integration — Get notified when sentiment hits extreme levels
The goal is to make sentiment data actionable, not just informational.
Track Fear & Greed + Get Trading Signals
Free
Flicker shows you market sentiment alongside AI-powered signals, smart money flow, and real-time alerts.
Summary
The Fear & Greed Index is a simple but powerful tool for understanding market psychology:
- Measures sentiment on 0-100 scale (fear to greed)
- Extreme readings often mark turning points in the market
- Use it as a contrarian indicator — consider buying in fear, selling in greed
- Combine with other analysis — it's one piece of the puzzle, not the whole picture
- Check it regularly but don't overreact to daily changes
Remember: the crowd is often wrong at extremes. When everyone is panicking, opportunities emerge. When everyone is euphoric, caution is warranted.
Not financial advice
This article is for educational purposes only. The Fear & Greed Index should not be used as the sole basis for investment decisions. Crypto trading is risky, and you can lose money. Always do your own research.
FAQ
What is a good Fear and Greed Index for crypto?
There's no universally "good" number — it depends on your strategy. For buying, many traders look for readings below 25 (extreme fear). For selling or taking profits, readings above 75 (extreme greed) can be a warning sign.
How often is the Fear and Greed Index updated?
Most providers update daily. Some platforms show real-time or hourly updates based on live data.
Is the Fear and Greed Index accurate?
It accurately measures sentiment based on its inputs, but sentiment doesn't always predict price movements. It's a useful tool, not a crystal ball.
Should I buy when Fear and Greed is low?
Low readings (high fear) have historically been good buying opportunities, but timing matters. Extreme fear can persist, and prices can keep falling. Use other indicators and risk management alongside sentiment.
What causes the Fear and Greed Index to change?
Price movements, trading volume, social media activity, volatility, and market news all influence the index. Large price drops increase fear; sustained rallies increase greed.
You might also like
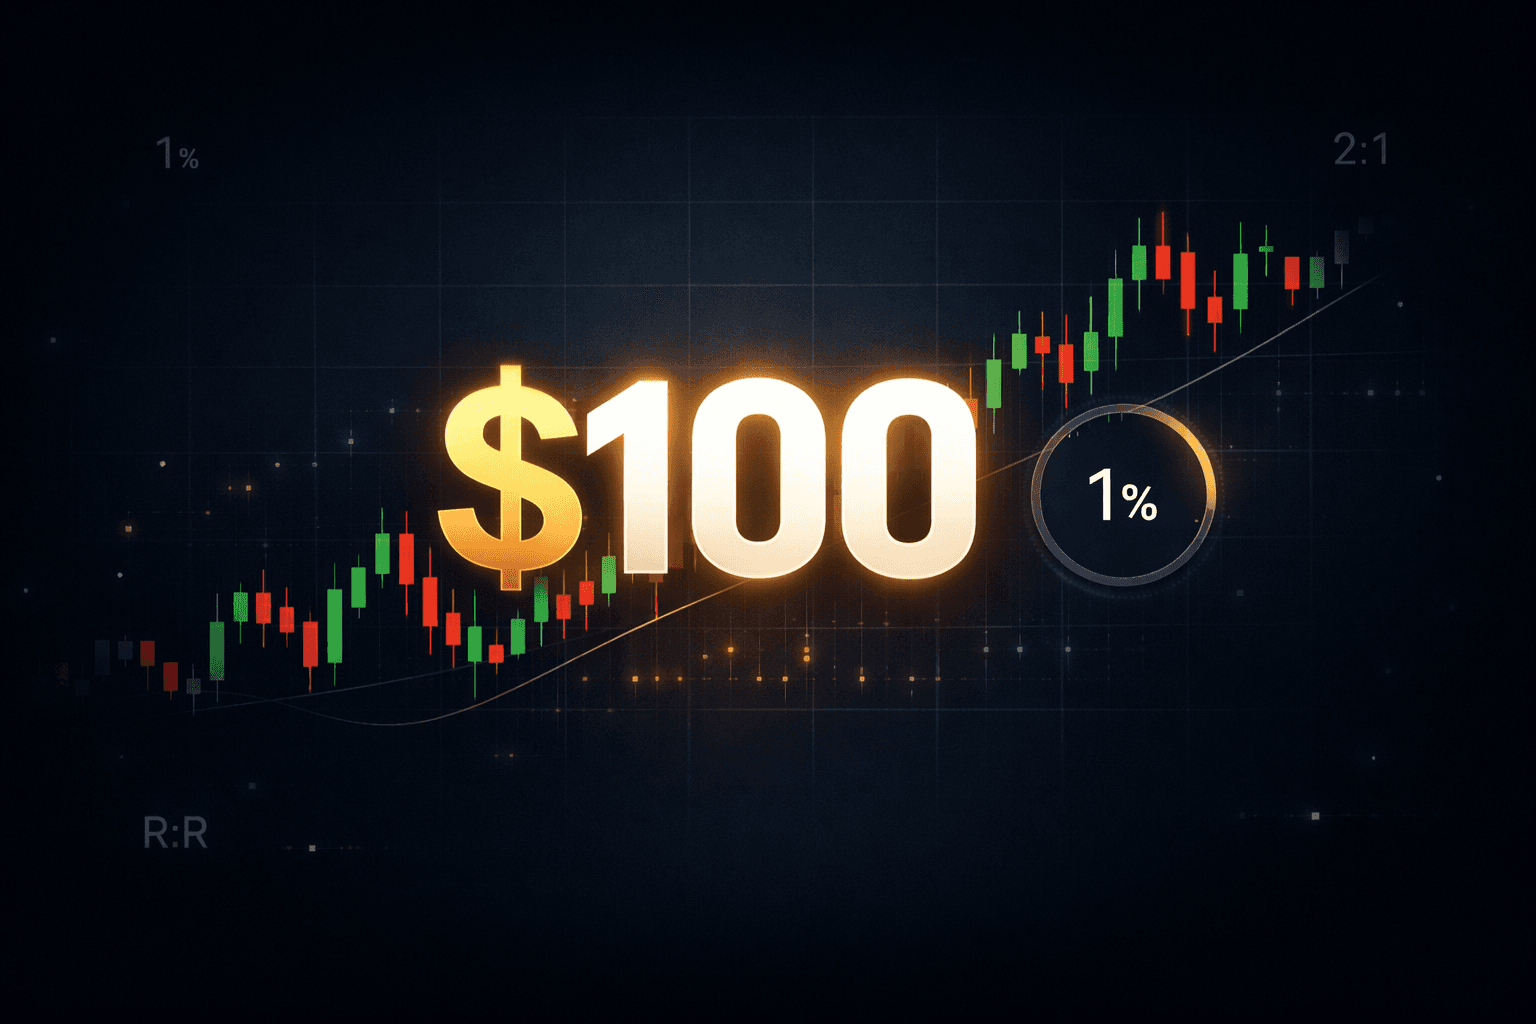
Can You Make $100 a Day Trading Crypto?
Most guides skip the hard part. Here's the actual math behind the $100/day goal, why most traders fail, and the tools that give you a real edge — no hype, no false promises.
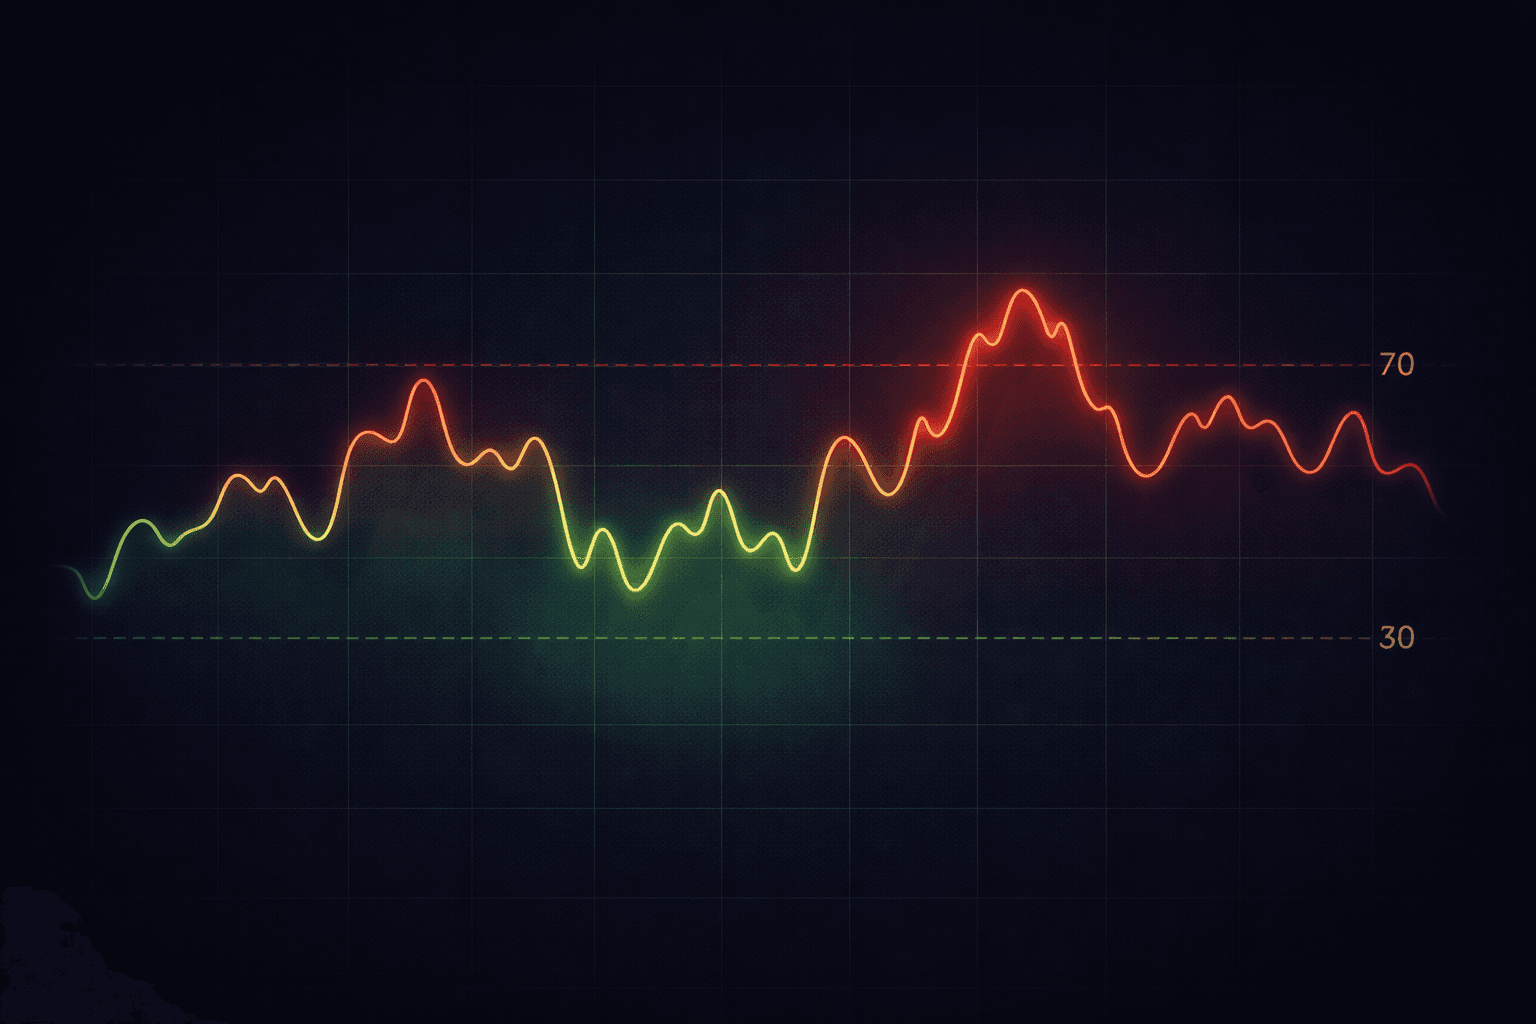
RSI Explained: How to Know If a Coin Is Overbought or Oversold
The Relative Strength Index (RSI) is one of the most used indicators in crypto. Learn how it works, how to read it, and how to avoid the mistakes most traders make with it.
Crypto Stop Loss Strategy: A Complete Guide
A stop loss is the difference between a bad trade and a blown account. Here's how to set stop losses that actually work in crypto — without getting stopped out by normal volatility.