



Guides
RSI explained: how to know if a coin is overbought or oversold
What RSI measures, how the 14-period formula works, what 70 and 30 mean, how to read a divergence, and why the exit comes before any RSI reading.
On this page
"RSI is overbought." "RSI hit 30." You see these lines under every crypto chart, often followed by a call to buy or sell.
RSI is worth understanding. It is also one input, not an answer. It tells you how hard price has been moving. It doesn't tell you where you'd get out if you're wrong, and that is the first thing to know before any entry.
This guide covers what RSI measures, how it is calculated, what 70 and 30 mean, how to read a divergence, and where RSI sits in Flicker's read of a coin.
What is RSI?
RSI stands for Relative Strength Index. J. Welles Wilder published it in 1978, and it has been a standard chart tool ever since.
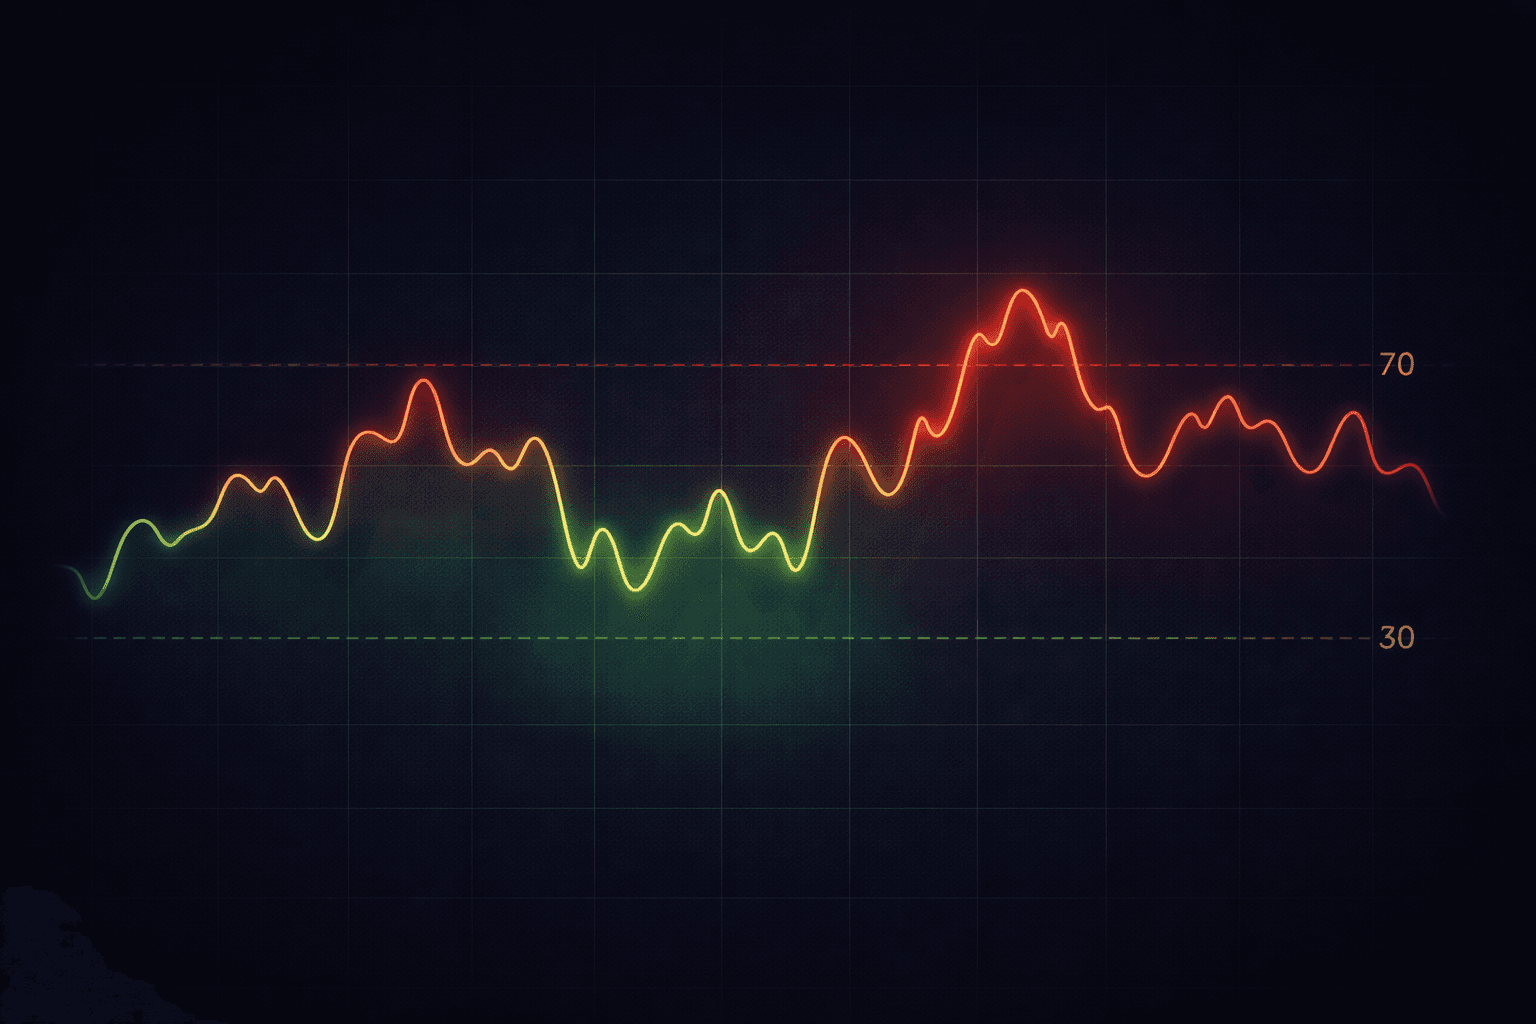
It is a number between 0 and 100 that compares the size of recent up moves with the size of recent down moves:
- Above 70: called overbought. Price has risen a lot in a short time.
- Below 30: called oversold. Price has fallen a lot in a short time.
- Between 30 and 70: neutral.
When up moves dominate, RSI climbs toward 100. When down moves dominate, it falls toward 0. When they roughly balance, it sits near 50.
RSI answers one question: how one-sided has the recent movement been? It says nothing about news, value or where the move ends.
How RSI is calculated
Every charting tool computes RSI for you, but the logic explains its behaviour.
RSI looks at the change from one closing price to the next over a set number of candles, usually 14. Up changes count as gains, down changes as losses.
RS = average gain ÷ average loss
RSI = 100 − (100 ÷ (1 + RS))
The first averages are plain means of the first 14 gains and losses. After that, Wilder's method smooths them: each new average is the previous one times 13, plus the latest change, divided by 14. One big candle therefore moves RSI gradually rather than all at once.
A worked example (illustration, not real data)
Over 14 daily candles, the up days add up to 210 and the down days to 140, in dollars.
- Average gain: 210 ÷ 14 = 15. Average loss: 140 ÷ 14 = 10.
- RS = 15 ÷ 10 = 1.5.
- RSI = 100 − 100 ÷ 2.5 = 60.
The next day closes 30 dollars higher:
- New average gain: (15 × 13 + 30) ÷ 14 = 16.07.
- New average loss: (10 × 13 + 0) ÷ 14 = 9.29.
- RSI ≈ 63.4.
A single strong day moved RSI by about three points, not twenty. That smoothing is why RSI can stay high, or low, through a long trend.
The 14-period default is what most charts use. A shorter period, such as 7, reacts faster and crosses 70 and 30 more often. A longer one, such as 21, is smoother and crosses them less. There's no correct setting; 14 is the one most people compare against.
What "overbought" and "oversold" actually mean
This is where most beginners go wrong.
Overbought (RSI above 70) is not an instruction to sell. It means price has risen fast. In a strong uptrend, RSI can stay above 70 for weeks, and price can keep rising the whole time.
Oversold (RSI below 30) is not an instruction to buy. It means price has fallen fast. In a sharp sell-off, RSI can sit below 30 for a long time, and price can keep falling.
Think of a stretched rubber band: the further it stretches, the more tension there is. RSI measures the stretch. It doesn't tell you when, or whether, it snaps back.
The key point: RSI describes how intense a move has been. It doesn't describe when the move ends.
How to actually use RSI in crypto trading
1. Decide where you'd get out first
Before RSI comes into it, answer two questions: where would you get out if the idea is wrong (the stop), and where would you take profit (the target)? Then ask whether you could accept the loss down to that stop.
An RSI reading can make a move look exciting or frightening. A stop you set beforehand doesn't change with the mood. RSI is one input you weigh after that.
2. Read the extremes in context
An extreme reading is a reason to look closer, not to act:
- RSI below 30: selling has been one-sided. Check whether price sits near a level where it has turned before.
- RSI above 70: buying has been one-sided. Check how far price sits from its last pullback.
Some traders shift the bands with the trend. A common convention is that in a strong uptrend RSI tends to hold between about 40 and 80, and in a strong downtrend between about 20 and 60. Treat those as rules of thumb, not fixed laws.
3. Read divergences
A divergence is when price and RSI disagree.
Bearish divergence:
- Price makes a higher high.
- RSI makes a lower high.
- Meaning: the latest push up had less force behind it than the one before.
Bullish divergence:
- Price makes a lower low.
- RSI makes a higher low.
- Meaning: the latest drop had less force behind it than the one before.
There is also a hidden divergence, which points the other way: price makes a higher low while RSI makes a lower low (hidden bullish), or price makes a lower high while RSI makes a higher high (hidden bearish). It is usually read as the existing trend still having room.
A divergence says momentum is fading. It doesn't say when price turns, and divergences can repeat several times before anything changes. It is something to weigh, next to the stop you already set.
4. Check trend health
RSI is not only about reversals. In a healthy uptrend, pullbacks often stop with RSI somewhere around 40 to 50 and turn back up. In a downtrend, bounces often fade with RSI around 50 to 60.
When RSI breaks out of the range it held during a trend, the trend may be changing. That is a question for the chart, not an answer.
5. Read pullbacks within a trend
Some traders who already like a trend wait for RSI to cool toward 40 to 50 before looking at an entry, rather than buying after a run. If you do that, the order stays the same: the stop and the target first, then the entry, then RSI as one more check.
Common RSI mistakes
1. Treating 70 and 30 as buy and sell orders
RSI at 70 doesn't mean "sell". RSI at 30 doesn't mean "buy". They are levels that say the move has been one-sided.
2. Using RSI alone
RSI measures momentum and nothing else. It doesn't know about support and resistance, volume, news or the broader market. Readers often combine it with:
- Support and resistance: an oversold reading at a level where price has turned before tells you more than one in the middle of a range.
- Volume: a divergence with falling volume says more than one with rising volume.
- MACD: RSI shows how stretched a move is; MACD shows whether momentum is growing or shrinking.
3. Ignoring the timeframe
RSI on a 5-minute chart and RSI on a daily chart describe different things. A coin can be overbought on the hourly chart and neutral on the daily. Shorter timeframes cross 70 and 30 far more often, so each crossing means less.
4. Fighting the trend
RSI reads oversold in a falling market. You buy. It falls further and RSI goes lower. You buy more. In a strong trend, an extreme can stay extreme. Oversold can get more oversold, and a stop set in advance is what limits that loss.
5. Skipping divergences
Many readers only watch 70 and 30 and never compare RSI's highs and lows with price's. Divergence is where RSI adds information that price alone doesn't show.
RSI vs other indicators
RSI vs MACD: RSI shows how stretched a move is on a 0 to 100 scale. MACD compares two moving averages to show whether momentum is growing or shrinking. They describe different parts of the same move; the MACD guide covers it.
RSI vs Bollinger Bands: Bollinger Bands show when price sits at the edge of its recent range. RSI shows when momentum is extreme. They measure different things, so they can disagree.
RSI vs Stochastic: Both are momentum oscillators on a 0 to 100 scale. Stochastic compares the close with the recent high-low range and reacts faster, so it crosses its extremes (usually 80 and 20) more often. RSI is smoother.
How Flicker uses RSI
Flicker computes a 14-period RSI on closing prices, with Wilder's smoothing, on the timeframe you're reading. It doesn't give a verdict from RSI alone. RSI is one input among several, in three places:
- The momentum factor. The verdict (buy, hold or sell) comes from six factors: trend direction, momentum, Fear & Greed, breakout setup, risk level and cycle phase. Momentum's direction comes from the rate of change; its strength blends RSI's distance from 50 with MACD. When price and RSI diverge over the recent candles, momentum is marked divergent, and its pull on the verdict shrinks.
- Fear & Greed. Flicker's own reading for each asset has a part that counts how many oscillators are at an extreme, with RSI above 70 or below 30 among them.
- Alerts. An RSI alert tells you when RSI crosses a level you choose, with 30 and 70 as ready-made templates. A momentum divergence alert tells you when price and momentum disagree. Alerts need a free account; set them up in Alerts.
RSI doesn't place the exit. Each zone's stop sits 1.5 times the average true range (ATR, the average size of the last 14 candles) beyond the zone's edge, so it answers the chart's own noise rather than an RSI level. The Bitcoin read shows the verdict, how the six factors voted and, when there is one, the nearest zone with its stop and target. The daily read is free, and you don't need an account to see it. Pro opens every other timeframe.
When an RSI alert fires, open the read and check the zone's stop and target before anything else. RSI is the reason to look; the exit is what you decide with.
Summary
- RSI measures momentum: how one-sided recent closes have been, on a 0 to 100 scale.
- Above 70 is overbought, below 30 oversold: levels to look closer at, not orders.
- The default is 14 periods with Wilder's smoothing, which is why RSI can stay extreme through a trend.
- Divergences show momentum fading when price and RSI disagree; they don't time the turn.
- Context matters: RSI behaves differently in a trend than in a range, and differently on each timeframe.
- The exit comes first: decide where you'd get out, then weigh RSI as one input.
FAQ
What is a good RSI for crypto?
There is no single good number. Below 30 says selling has been one-sided; above 70 says buying has been. In strong trends many readers use shifted ranges, about 40 to 80 in an uptrend and 20 to 60 in a downtrend. None of these numbers is a buy or sell level on its own.
What RSI level means overbought?
Above 70 is traditionally called overbought, and above 80 strongly overbought. In a strong uptrend RSI can stay above 70 for a long time without a pullback. Overbought means look closer, not sell.
What RSI level means oversold?
Below 30 is traditionally called oversold, and below 20 deeply oversold. Oversold can last through a strong downtrend. An oversold reading at a level where price has turned before tells you more than one in open space.
Is RSI accurate for crypto?
RSI isn't a forecast, so it can't be accurate or inaccurate in that sense. It describes how one-sided recent moves have been, and it does that the same way on any chart. Crypto moves fast, so RSI reaches its extremes often, which is why it works best as one input beside the stop, the target and the trend.
What is RSI divergence?
A divergence is when price and RSI move in opposite directions. Bearish divergence: price makes a higher high while RSI makes a lower high. Bullish divergence: price makes a lower low while RSI makes a higher low. Both say momentum is fading; neither says when price turns.
Should I use RSI for day trading crypto?
You can, with care. On 5-minute or 15-minute charts, RSI crosses 70 and 30 many times a day, and most crossings lead nowhere. Some day traders check the daily RSI for the bigger picture and use a shorter timeframe for detail. Whatever the timeframe, set the stop before the entry.
We analyze. You decide. We never trade for you.
Get Flicker
A verdict from six factors, momentum among them, and each zone's stop and targets. Start free.


Related:
- MACD explained: the other momentum indicator in Flicker's momentum factor.
- Crypto stop loss strategy: where to put the level where you'd get out.
- How to know when to sell crypto: planning the exit before the entry.
Analysis, not advice. Prices move; you can lose money.
- RSI
- technical analysis
- overbought
- oversold
- RSI divergence
- momentum
- crypto analysis
You might also like
Guides9 min read
Trading apps for crypto, stocks and forex in 2026: which read all three
One app for Bitcoin, a few stocks and EUR/USD: what each kind of app does with all three markets, where it stops, and what to check first.

Guides7 min read
Ethereum analysis 2026: reading its buy zone, stop and targets
What Flicker's Ethereum read shows before you buy: the verdict and how many of six factors agree, each zone's stop and targets, and when to enter.

Guides6 min read
Hyperliquid analysis 2026: reading its buy zone, stop and targets
What Flicker's Hyperliquid read shows before you buy: the verdict and how many of six factors agree, each zone's stop and targets, and when to enter.